
dc water
overview
DC Water is a utility company that provides drinking water, collects and treats wastewater, and maintains fire hydrants in Washington, D.C. and the surrounding areas. They serve about 681,000 residential customers across 725 square miles.
As part of their daily operations, they maintain a 24-hour emergency hotline to respond to leaks, floods, sewer problems, and other water-related emergencies. During large-scale emergencies, they often receive an overwhelming number of phone calls, despite the fact that they have a form on their website that customers can use to report problems. Their goal is to reduce the number of phone calls that they receive to the hotline and increase the efficiency of the reporting process.
-
DC Water, in partnership with UMD’s iConsultancy Program
-
January 2022 – May 2022
-
6 graduate students from the HCI Program at UMD
-
UX Research, UX Design, Usability Testing, Visual Design, Interaction Design, Prototyping, Team Facilitator (Sprint 3)
-
Figma, Miro, Slack, Google Workspace, OptimalSort
long-term goal
To reduce the number of phone calls that they receive to the hotline and increase the efficiency of the emergency reporting process.
design process
Over the course of this project, we used Google’s Design Sprint Methodology to guide our design process. We completed two, four-week-long Design Sprints over the course of the semester. As the project progressed, we adapted and modified the Sprint process when necessary to best serve the needs of the project and of the client.
-
Set the Sprint goal, define and map the problem
-
Research competing solutions, sketch potential design ideas
-
Prototype design solution
-
Conduct user testing, analyze findings

sprint 1
week 1
During the first week, we defined the problem and set our Sprint 1 goal after meeting with our client and discussing their needs and expectations for the project. We also decided to do some testing using OptimalSort and Miro to learn what terms people typically use to categorize and describe water-related issues.
sprint 1 goal
To create a webform that (1) helps users easily identify the type of issue to report by removing technical language, (2) helps users determine if their issue qualifies as an emergency, (3) quickly and accurately captures emergency-only reports, and (4) increases customer reporting.
language testing
-
For our first test, we showed our participants images of a variety of water-related issues and asked them to (1) group similar images into categories and (2) give those categories a name. From this activity we were able to learn what words people typically use to describe these issues and also what issues people tend to group together.
-
For our second test, we used the category names that users came up with during the card sorting activity and turned them into a word bank. We also brainstormed several of our own water-related words and added those to the word bank as well. We then showed a different group of users images of potential DC Water issues and asked them to select words from the word bank to describe each of those images. From this activity we were able to gather even more insights into what water-related terminology people are and are not familiar with.
After this activity, we analyzed our findings by creating a word cloud for each issue with the words that our users chose. By creating word clouds, we were able to quickly see which words people used the most to describe each scenario. We then used these findings to inform the language choices that we later made when designing our webform.
week 2
During this week, we sketched potential design solutions and decided which ideas to move forward with. We also utilized a spreadsheet of past reported emergencies to create user scenarios, which we then used to ensure that we were accounting for all possible issue types when designing the information architecture for the form.
information architecture
When we were deciding on the information architecture of the form, each of us brainstormed our own structure before coming together to discuss it as a team and make our final decisions. Here is an image of the information architecture that we decided on:

week 3
This week we prototyped a high-fidelity webform design using the information architecture that we decided on and findings from our card sorting activities.
report a problem form
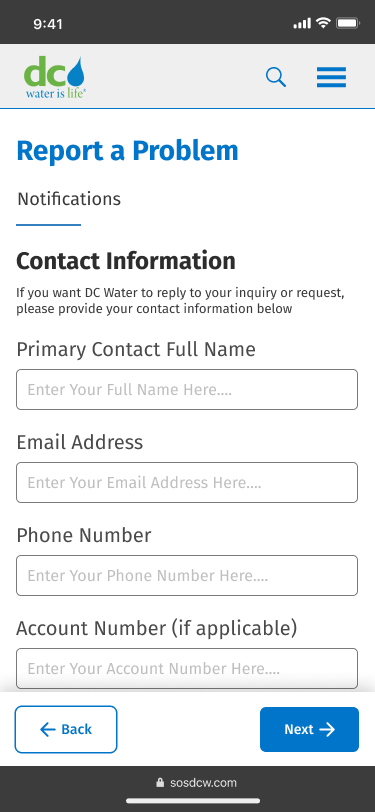
-
![]()
Landing Page
-
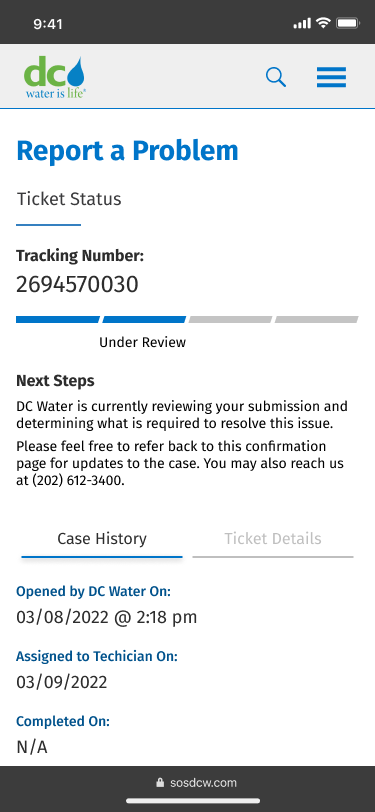
![]()
Track Your Report


prototype demo
week 4
This week we tested our prototype with 16 users. Some teammates conducted long-form interviews, while I, along with one other teammate, conducted a shorter version of our test plan in a man-on-the-street format. Since we were in charge of finding our own users to test with, the man-on-the-street interviews allowed us to get the perspective of people outside of our typical testing pool. We showed each user a photo of a water-related issue and asked them to report this problem using our form. We tested 5 different scenarios in all, and our average user confidence score was a 4.6/5.
sprint 2
week 1
After discussing the current state of the project with our client, we set our Sprint 2 goal and defined our new problem. We also updated our form design from Sprint 1 with final design changes based on testing and client feedback and passed it off to the development team.
sprint 2 goal
To (1) update the Report a Problem Form to incorporate findings and recommendations from user testing and (2) create a Customer Service Form for users to submit non-emergency requests.
week 2
This week we sketched potential design solutions for the Customer Service Form. We also decided on new information architecture for non-emergency requests based on the “Contact Us” options that were already on DC Water’s website and a record of past inquiries.
week 3
During Week 3, we prototyped the Customer Service Form and prepared our user test plan.
customer service form
-
![]()
Landing Page
-
![]()
Select a Topic


prototype demo
week 4
We tested the Customer Service Form with 5 users. We presented each user with a non-emergency scenario and asked them to use this form to contact DC Water about the scenario. All of our users described the form as easy to use, and the average confidence score was a 5/5.
sprint 3
week 1
After presenting both of our webforms to the client and passing them off to the development team, we decided to explore potential alternative solutions for reporting a problem. During this week, we mapped out the problem space, decided on our Sprint 3 goal, and gave lightning demos of similar or competing products.
sprint 3 goal
To increase the accuracy and efficiency of customer reports by exploring new design solutions.
lightning demos
For these demos, each team member researched different customer service solutions from various companies and shared them with the group. This helped us brainstorm potential design ideas for DC Water’s emergency reporting system.
week 2
This week each member of the team sketched potential design solutions. We came up with the following design ideas during our sketching sessions:
Chatbot
Public Kiosk
Interactive Map
SMS Chat
Video Chat
Image Recognition
We then asked DC Water to vote on their favorite solutions. The design ideas that got the most votes were chatbot and image recognition, so we decided to split into two smaller teams to pursue these solutions. I was on the chatbot team.
After splitting off into the chatbot team, we decided on a scenario to prototype and created a storyboard for that scenario. We also started discussing what kind of language we would like to use for the chatbot.
week 3
During this week, we created a prototype for our chatbot scenario and started planning our user testing sessions.
prototype demo
week 4
This week we tested our chatbot solution with users. We tested with 6 participants, and for each testing session, we described our scenario and asked users about their thoughts on the current prototype. We also asked users if our chatbot was similar to what they were expecting in an attempt to determine if our prototype matched users’ mental models. Our participants generally found the chatbot very easy to use, even those who were not very good with technology. Our average confidence rating was a 4.8/5.